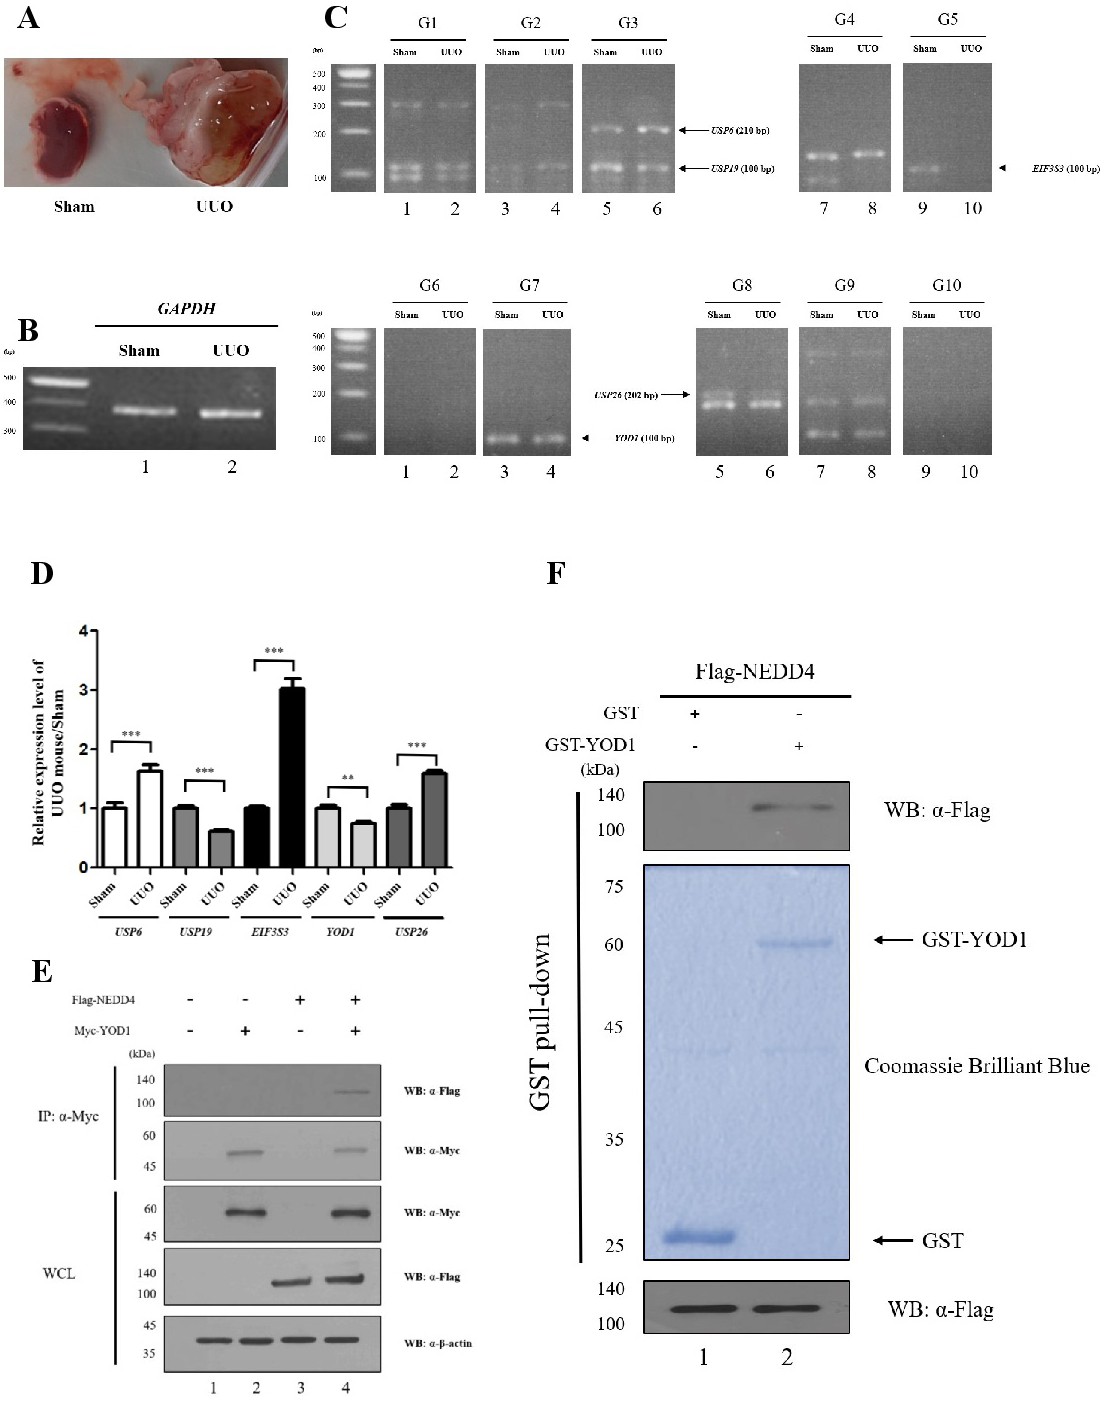
Fig. 1. (A) The kidneys of the control and UUO mice were extracted and confirmed. (B) The mRNA level of GAPDH was determined by RT-PCR and used as an internal control. (C) DUB screening was performed through multiplex PCR, and PCR product was loaded on 2% agarose gel. (D) Densitometric analysis was conducted using Image J to analyze the expression level of YOD1. The expression level of GAPDH was used to normalize YOD1 expression level. (E) Flag-NEDD4 and Myc-YOD1 were co-transfected into 293T cells. An anti-Myc antibody was used for immunoprecipitation. (F) Purified GST or GST-YOD1 was incubated with 293T cell lysates overexpressed with Flag-NEDD4. Protein bound to GST-YOD1 was detected through Western blotting. GST control and GST-YOD1 were visualized using Coomassie Brilliant Blue R/G staining solution.